Really BIG Data
by Abe Sherman – CEO, BIG – Buyers Intelligence Group
February 02, 2021
What to do with Really BIG Data?
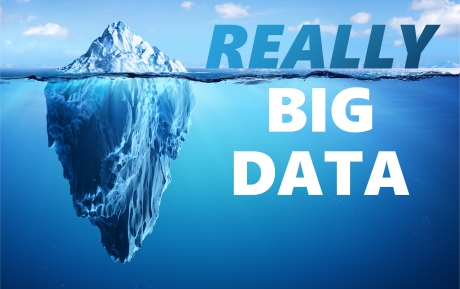
I believe anyone would agree that once our database contained something north of $3 Billion in annual retail sales, it should be thought of as BIG Data. Even better, our database includes retailers from every corner of the country, as well as some in Canada. We work with single stores and companies with dozens of locations; mall stores and free-standing; heavily branded and stores that do mainly their own designs and custom work. In short, we have a very broad cross-section of the retail jewelry market.
For years we have been reluctant to do anything outside of our known services with all of this data. But, for the purposes of providing anonymous, high-level industry analysis to companies who would like to know overall trends, and after reading much of the information that is being published, without our input, we have concluded that providing 30,000 foot-view level reporting, sufficiently scrubbed and aggregated of course, would benefit both those who publish these reports and our client base and data-share partners. I should add, we get asked to provide this level of information from every corner of the industry; retailers, suppliers, industry magazines, trade associations, mining companies, everyone.
For example, we often get asked about “share of wallet”, or how much of the independent channel’s business is bridal compared with fashion or watches. Or independents compared with national chains, department stores, wholesale clubs, or strictly online businesses. At a high-level, many manufacturers don’t even have a good sense of what retail price points are selling within each of the categories they manufacture! This is an issue for them, of course, but it doesn’t help retailers either. In the end, it’s better for them to know that $1,000-$1,500 is the number one selling diamond wedding band in the US year-in and year-out. This information helps develop merchandising price ladders for their collections and offers retailers better selections in the areas that are performing the best.
What we won’t do is to provide competitive analysis, comparing one brand to other brands, for example. And while we may do something like very broad reporting by region, we’re thinking about aligning with how the country breaks down by US Census regions (West, Midwest, South, Northeast); what’s trending in the North East, compared with the West kind-of-thing, and we wouldn’t get more specific than that.
The challenge with having this much data is how best to utilize it to help the industry make better decisions and we (and when I say, we, I mean me) have been pushing back against anyone asking for this level of information for years. But then, I had a conversation with a well-known appraiser who asked if we could provide him (and the appraisal association he belongs to), with transaction prices of diamonds by shape, weight, qualities, lab reports, etc., to help appraisers across the country come to a more accurate appraisal determination. I gave him every reason why it was not something we do (I’ve gotten very good at that over the years), but that conversation has been gnawing at me, and I think we can offer a lot of useful information to those in our industry who need it to make better decisions.
More than a decade ago, we created standardized categories that we use for our Plexus group benchmarking; Bridal, Loose Diamonds, Diamond Fashion, Non-Diamond Fashion, Color, Watches, Estate, etc., and we can roll up each retailer’s categories into these very broad, high-level standardized departments. We would be able to report on this information for industry reporting purposes, but also, and I think more importantly, we will be able to show the clients we work with how their own results stack up against the total industry dataset. Seriously, we get asked about this from our clients on a daily basis, and I’ve run out of good reasons not to.
To facilitate this new high-level of reporting and analysis, we thought it would be prudent to ask our intellectual property attorney to write language into our agreements that gives retailers we are receiving data from the opportunity to specifically opt out. If you don’t want your data included in the dataset, you can opt out, and while we’re going to respect your choice, we think you’ll be missing a lot of very useful industry information in return. We’re expecting most of the people whom we work with will participate since the value of getting this higher level of analysis would be extremely beneficial:
- High-level industry-wide aggregated reports
- Nationwide KPI analysis regarding margins, turns, aged, etc.
- Ability to compare your business to others of the same type (Bridal, Watch, Branded, Luxury)
- Ability to compare your company’s sales trends compared to nationwide trends
- Ability to compare your category/price point sales against regional results
We anticipate releasing the first glimpse of this data in the first quarter of 2021 in a quarterly newsletter series that will be free to all participants. As we get into deeper level of analysis, a subscription-based service will likely become available. This would include a detailed analysis of industry-wide trends of margin, turn, sales by category, along with the ability to easily benchmark your business against industry averages along several axes.
We look forward to providing a higher level of insight into the industry that all can benefit from. Over the coming weeks we will be sending each of our clients and data-share partners updated terms with specific language to address permission to share anonymous data in order to receive back trending information and comparison reports.
Don’t hesitate to email me directly with your questions or concerns.
Abe Sherman


