With 2023 behind us, now is a great time to see how your business has trended over the past 5 years. The Balance to Buy By-Period feature helps you analyze, track trends, and compare how the year ended against previous years. You can use the By-Period feature in any Summary Detail Report, so you are able to compare Vendor performance, Level & Category performance, Associate performance, and more. For this example, we will do a total Company 5-year trend.
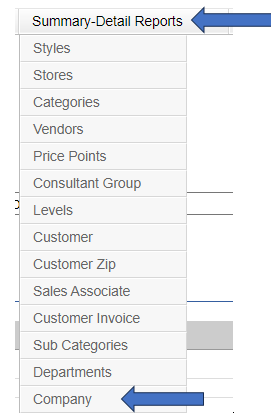
1.Select the type of Summary Detail Report you want to run by hovering over the Summary-Detail Reports tab and clicking on the report you want to pull.
2.To analyze the past 5 years of total Company sales, change the Sales Start Date to 01/01/2019 and the Sales End Date to 12/31/2023. You can analyze any sales time range you like, just be sure to adjust the sales start and end dates to your needs. Select any filters you want applied to the report. Lastly, in the By Period dropdown, select Year and hit the Apply Filters button.
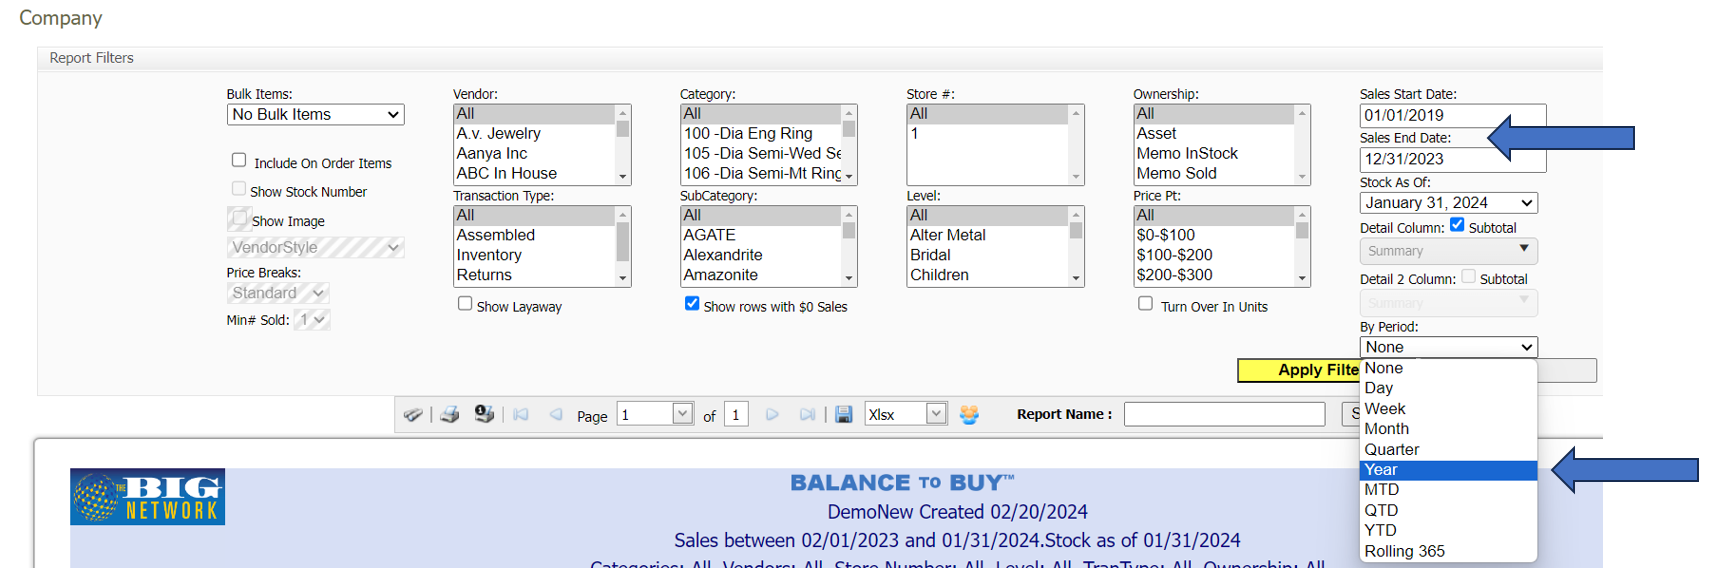
You will see different options in the By Period dropdown menu. Below gives a brief explanation of each.
- Day – this will show your data by day for the time frame selected.
- Week – this will show your data by calendar week for the time frame selected.
- Month – this will show your data by month for the time frame selected.
- Quarter – this will show your data by calendar quarter for the time frame selected (Q1 – JAN to MAR, Q2 – APR to JUN, Q3 – JUL to SEP, Q4 – OCT to DEC).
- Year – this will show your sales by year for the time frame selected.
- MTD – this will show your month-to-date sales for the same time frame. You can look at the data for a month that is complete for as many years back as we have data, or you can look to see how your current month is trending compared to previous years.
- QTD — this will show your calendar quarter-to-date sales for the time frame selected.
- YTD – this will show your year-to-date sales for the same time frame.
- Rolling 365 – this will show your rolling 365 data. If you go back multiple years, it will stack your first rolling 365, rolling 365 days back from that and so on.
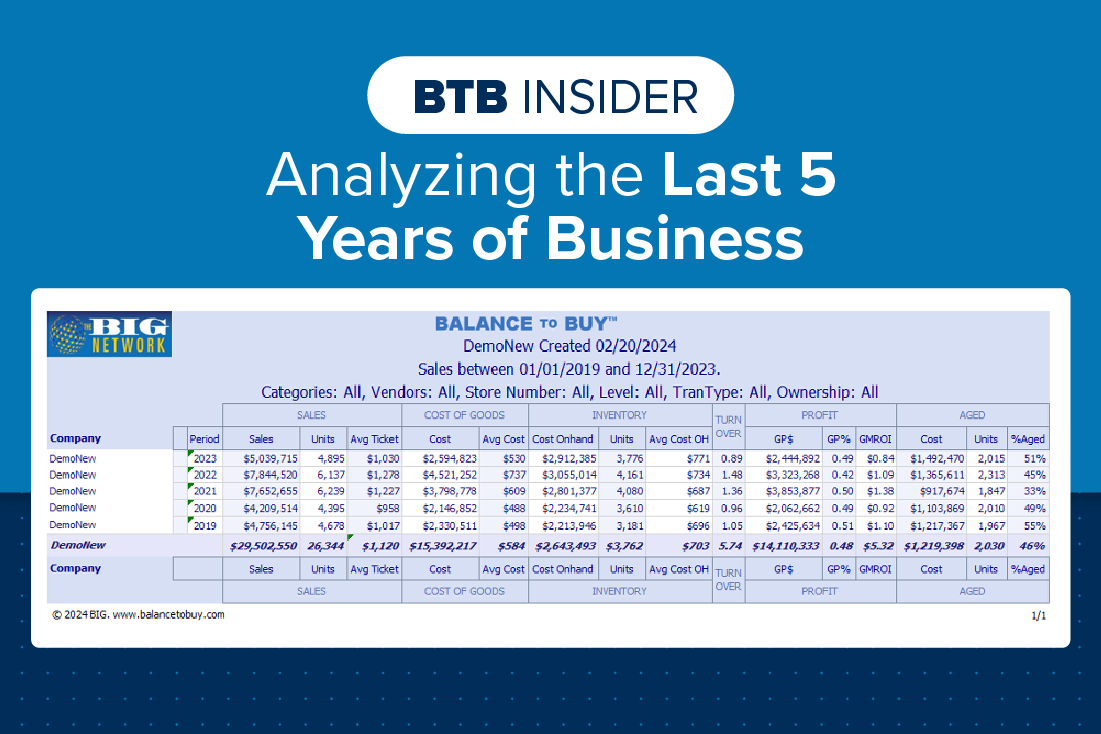
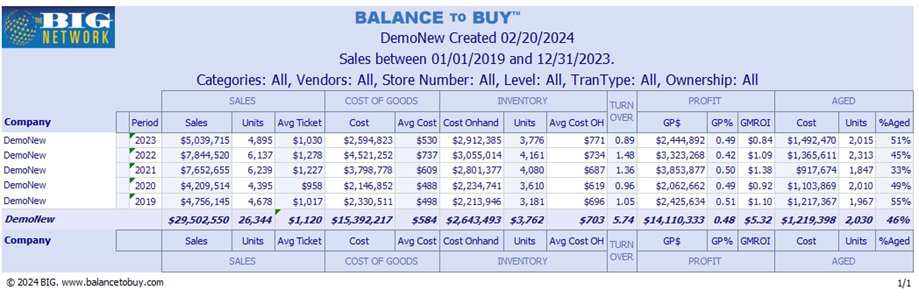
3.After you select Apply Filters, your data will be stacked based on the By Period you selected. Below shows the total company 5-year trend. Here you can identify trends for retail sales, units sold, average ticket, ending inventory, gross profit $ & % as well as aged inventory.
Contact your Balance to Buy Consultant for help, we are just a call or click away!
DO YOU HAVE A BTB INSIDER TIP?
Submit your BTB Insider tip to info@bigjewelers.com and you may see it in our next Balance to Buy Insider email!