
By Abe Sherman, CEO BIG
When we read reports about sales, we think in terms of categories or vendors, or even price points. It’s an analytical process where we use KPI’s such as turnover and gross profit or GMROI to measure the success of whatever it is we are reviewing.
As part of the benchmarking discussions we have at our Plexus group meetings, we do various exercises drilling-down into a retailer’s data – showing where there are opportunities to grow sales. Often we find segments of the business where there is too little merchandise given the last 365 day’s sales, and recommend feeding those segments in order to grow sales. More often still, we find segments of the business that are overstocked based on the same year of sales data. However, we try keeping the conversation to identifying growth opportunities during these discussions.
Here’s the thought process: We look at a category for standard KPI information such as turn, in this example, .94, which is pretty good. Next we look at GMROI (how much gross profit are we generating based on our current inventory), again, in this case, $0.73 which is lower than we’d like but that’s for another discussion.
Now take a look at the Avg Cost ($874) compared with the Avg Cost On Hand ($1,060) and you find a clue that the On Hand inventory may not be perfectly aligned with what’s being sold.

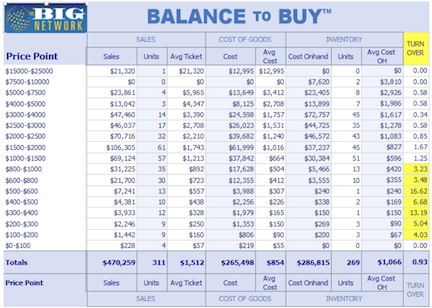
Drilling down into this information by Price Point, we see the 316 sales organized by price point. I highlighted the right hand column to show you how, even though we are getting an overall turn of .94, as you can see, below $2,000 retail our turnover is considerable higher. So, the conversation gets into merchandise planning at the category / price point levels in order to grow sales.
However, I want to point out something else to you, and it’s not about your inventory, it’s about your customers. Using the same example as above, I’ve highlighted the number of transactions within each price point. Of course, it’s natural to think of these numbers as representing your sales, but I’d like you to think about these numbers not as sales, but as customers. It doesn’t matter which category you do this for, so we’ll call this Category X, and we’ll call your Price Points “Y”. Interestingly, when you run these price point reports for each of your categories, you may notice a bell curve which creates a somewhat rounded curve with a peak which tapers down on either end. Looking at the data below, the peak is in the $1,500 ball park (average) with roughly 60 people making purchases and then falls by ½ on either side of that peak. Of the 311 people who purchased from this store within this category over the past 12 months, 118 of them were in that narrow range, and, it looks like there is plenty of inventory on hand to serve those customers.
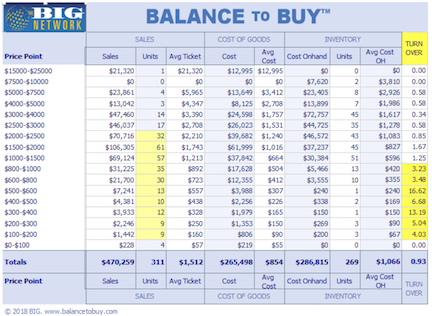 However, in sales under $1,000, slightly more customers, 122, made purchases over that same time frame but look at the inventory selection for the next 122 customers walking in the door!
Budgeting and planning addresses sales and inventory, and should, when done properly be done by price point. In addition to what is an analytical thought process, try thinking about these 311 sales as customers, not items. Think about what you have to offer the thousands of people who want to buy from you, have it in your box, in your bag with your gift wrapping. Merchandise for people, not for Category X.