It’s hard to believe that the first half of 2024 is behind us! July is a great time to check in to see how business is trending YTD compared to previous years. This will allow you to make an action plan for the next 6 months, spot any trends that are happening as well as identify areas of opportunity. Balance to Buy makes this analysis quick & easy. Follow the below steps to create a YTD Trend report.
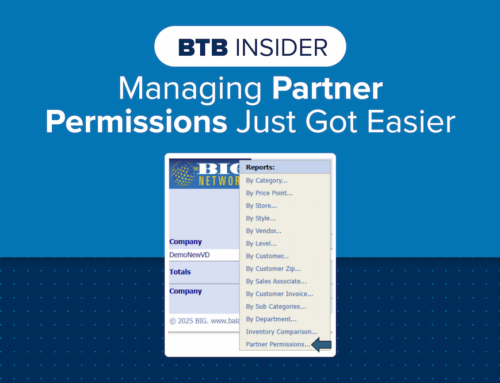
1. Balance to Buy allows you to create a YTD Trend report for any Summary Detail Report which means you can analyze Vendor, Level, Category, Associate performance, and more. To select the Summary Detail Report you want to create, hover over the Summary Detail dropdown menu. For this example, we will do a Levels YTD Trend report.

2. For this example, we will compare 2024 to the past 3 years. Change your Sales Start Date to 01/01/2021 and the Sales End Date to 06/30/2024. You can analyze any sales time range you like, just be sure to adjust the sales start and end dates to your needs. Select any filters you want applied to the report. Lastly, in the By Period dropdown, select YTD and hit the Apply Filters button.

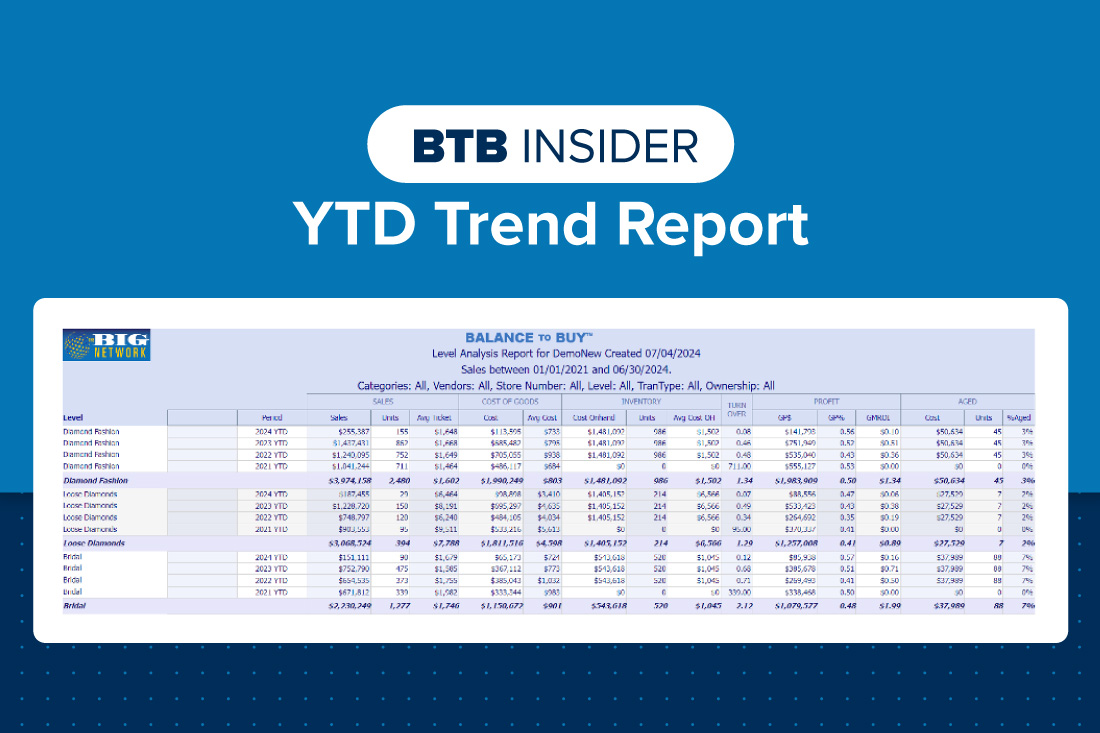
3. After you select Apply Filters, your data will be stacked YTD for the period you selected. Below shows the Levels YTD trend beginning from 2021. Here you can identify trends for retail sales, units sold, average ticket, ending inventory, gross profit $ & % as well as aged inventory.

Contact your Balance to Buy Consultant for help, we are just a call or click away!
DO YOU HAVE A BTB INSIDER TIP?
Submit your BTB Insider tip to info@bigjewelers.com and you may see it in our next Balance to Buy Insider email!