By using the By Period function in Balance to Buy, you can track business trends across your data by several different periods of time. Having the ability to analyze trends at a daily, weekly, monthly, quarterly, or annual period allows you to see shifts in your business and make the necessary adjustments. You can use the By Period function to benchmark store, level, category, vendor, sales associate, or even price point performance to see where your business is performing and where improvements can be made while looking at the same historical time frame.
The By Period function is available in ANY of the Balance to Buy Summary Detail Reports. For this example, we will use the Summary Detail Company report, to compare our data for the entire Company for different periods.
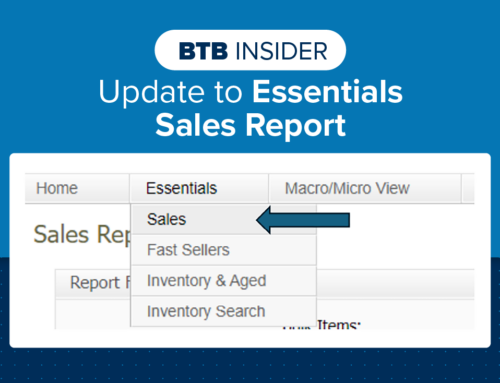
1. Under the Summary Detail reports tab, select Company
2. Select any applicable Filters
3. Adjust the Sales Start and End Dates. You want to change the Sales Start Date to the 1st day you want to start trending from and the Sales End Date to the last date you want included in your period.
4. With the By Period drop down menu, select the Period you want to trend for. Below has the different examples of the By Period options with an example of how you may use them and how to set up sales start and end dates.
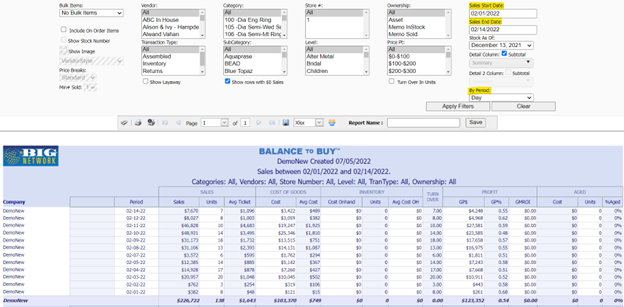
Day – this will show your data by day for the time frame selected. If you want to see your sales by day in 2022 for the 2 weeks leading up to Valentine’s Day to plan for 2023 you would set your Sales Start Date to 02/01/2022 and Sales End Date to 02/14/2022.
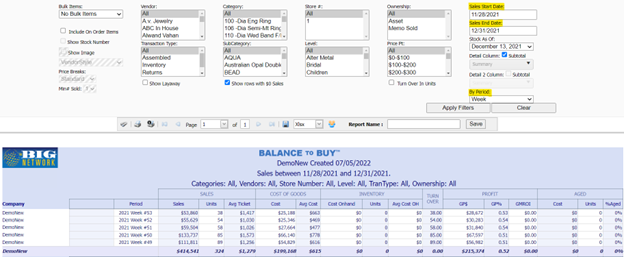
- Week – this will show your data by week for the time frame selected.
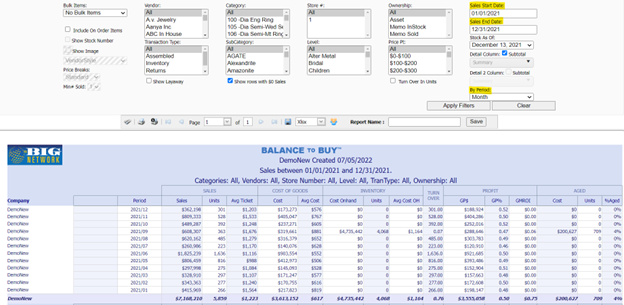
- Month – this will show your data by month for the time frame selected.
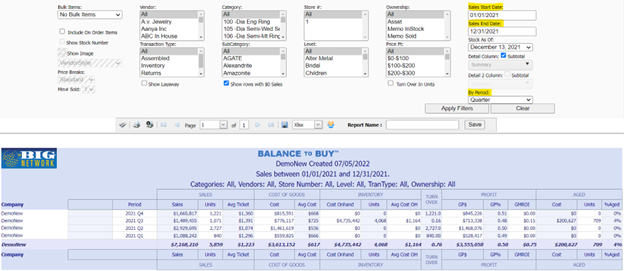
- Quarter – this will show your data by calendar quarter for the time frame selected (Q1 – JAN to MAR, Q2 – APR to JUN, Q3 – JUL to SEP, Q4 – OCT to DEC).
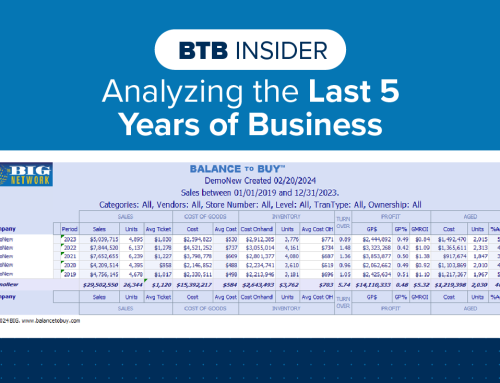
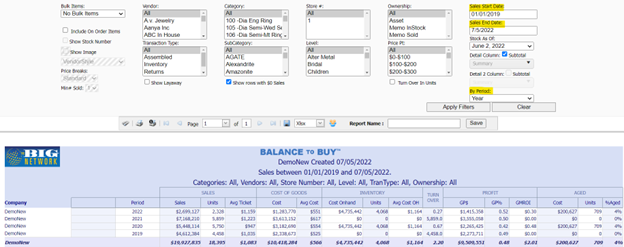
- Year – this will show your sales by year for the time frame selected. In the example below, we have decided to show annual data starting from 2019, which is why the sales start date is 01/01/2019. We can see the complete year for 2019, 2020 & 2021 and up to our last day of business for 2022.
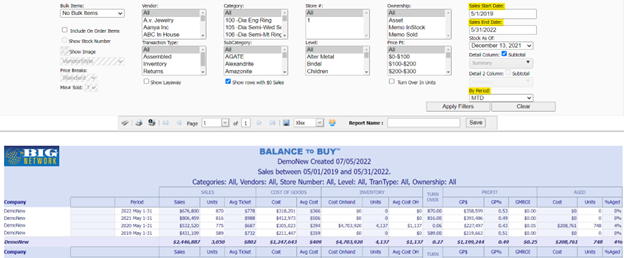
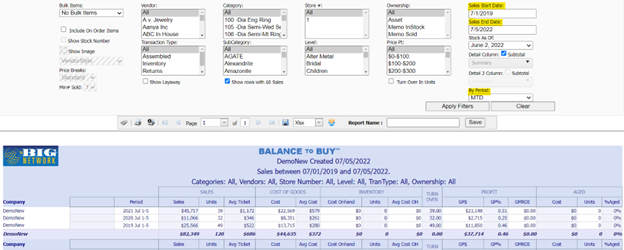
- MTD – this will show your month-to-date sales for the same time frame. You can look at the data for a month that is complete for as many years back as we have data (shown in 1st image), or you can look to see how your current month is trending compared to previous years (shown in 2nd image).
- YTD – this will show your year-to-date sales for the same time frame.
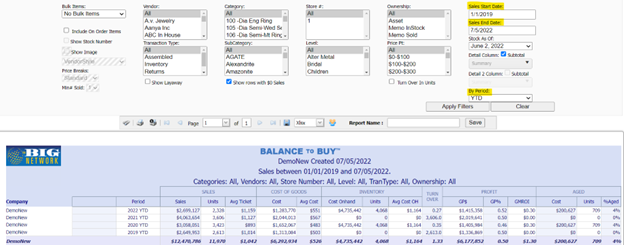
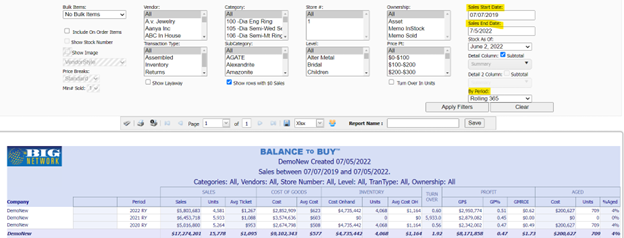
- Rolling 365 – this will show your rolling 365 data. If you go back multiple years, it will stack your first rolling 365, rolling 365 days back from that and so on.
Contact your Balance to Buy Consultant for help, we are just a call or click away!
DO YOU HAVE A BTB INSIDER TIP?
Submit your BTB Insider tip to info@bigjewelers.com and you may see it in our next Balance to Buy Insider email!

